利用 Lighthouse 與 Puppeteer 對全站網頁做效能檢測並產生報表
21 Aug 2020
本文主要是記錄如何在專案中簡易下指令來自動執行 Lighthouse 與 Puppeteer 做全站網頁的效能檢測、產生報表與其目錄。
什麼是 Lighthouse?
Lighthouse 是由 Google 開發的開源自動化檢測網站品質的工具,檢測後能給出有建設性的建議,直接告訴我們要改善什麼地方、要怎麼改,而且還有文件可查、有範例可看,能參考的資源很多,並且會將檢測結果和建議產出人機皆可閱讀的報表,可檢測效能、無障礙功能、漸進式網頁應用程式(PWA)、最佳作法和搜尋引擎最佳化(SEO,使用 Search Console 工具會更好)。
使用 Lighthouse 有以下幾種方法
- Lighthouse in Chrome DevTools
- Lighthouse Node CLI
- Lighthouse Chrome Extension (已廢棄,點此看詳情)
web.dev網站
這裡主要是選用 Lighthouse Node CLI 來做全站各頁的檢測,這是因為稍等會看到…要檢測的網站有些頁面是需要登入的,只靠 Lighthouse 恐怕不夠用,還需搭配 End-to-End Testing 工具才能完成工作。
為何選用 Lighthouse?
雖然能做效能檢測的工具很多,除了 Lighthouse,還有 PageSpeed Insights、WebPage Test、Pingdom 等,相關介紹可參考這裡…這些工具各有自己的長處,但 Lighthouse 提供 Node CLI 版本,易於整合其他自動化工具,因此就選用它了。
如何使用 Lighthouse 做效能檢測?
如前所述,由於要檢測的網站有些頁面是需要登入的,因此需要搭配 End-to-End Testing 工具做登入的動作,並導頁到要檢測的頁面來做檢測,這裡選用 Puppeteer;再來,Lighthouse 並不會幫我們做產出報表的目錄,因此我找了 Table-Builder 來協助製作目錄的表格…綜合以上需求,就必須安裝 Lighthouse、Puppeteer、Table-Builder 與 fs。
yarn add lighthouse puppeteer table-builder fs
備註,除了 Puppeteer,還可選用的 End-to-End Testing 工具很多,像是 WebdriverIO、Nightwatch 都可以…最重要考量的點,是有沒有結合 Chrome DevTools,這樣之後才能做更多客製化的效能檢測。
如何檢測需要登入的頁面?
再次,如前所述,直接使用 Lighthouse 來檢測需要登入的頁面是不可行的 因為根本看不到啊,要怎麼檢測 解決方法是先使用 Puppeteer 來做登入,而由於要借助 End-to-End Testing 工具來做登入的動作,並導頁到要檢測的頁面來做檢測,因此就要寫一支測試程式來做這些事情。
以下程式碼片段會做以下幾件事情…
- (1) 到達首頁。
- (2) 點擊「登入按鈕」。
- (3) 輸入帳號、密碼。
- (4) 輸入密碼。
- (5) 送出輸入的帳號、密碼,登入成功。
程式碼片段說明如下…
async function navigateToIndex() {
  const browser = await puppeteer.launch({ headless: true });
  const page = await browser.newPage();
  const indexURL = context['env'] === 'DEV' ? DEV_HOST : PROD_HOST;

  console.log('Navigating to index...');
  await page.goto(ENV); // (1) 到達首頁

  console.log('Starting login, entering username and password...');
  await page.click('#login'); // (2) 點擊「登入按鈕」
  await page.type('#account', 'test'); // (3) 輸入帳號
  await page.type('#password', 'test'); // (4) 輸入密碼
  await page.click('#submit'); // (5) 送出輸入的帳號、密碼

  console.log('Login success!'); // 登入成功
  return browser;
}
這樣就登入成功摟,然後稍等會導到要檢測的頁面…
如何檢測全站頁面、產生報表?
接下來,依舊使用 Puppeteer 幫我們遍歷全站網頁,並針對每個網頁用 Lighthouse 做檢測,然後產出報表。
如下程式碼,TEST_PAGES 是一個存放頁面列表的常數變數(例如:這個存放頁面列表的常數變數可能是長成這樣 [{id: '...', link: '...'}]),利用 for 迴圈將整個網站的每個頁面都跑一遍;當中使用 Lighthouse 檢測,這裡會產出兩種格式的報表-HTML 與 JSON,再利用 Lighthouse 內建的 reportGenerator 畫出報表;最後使用 TableBuilder 做總結,產生一份簡單的目錄來作 report cover。
以下程式碼片段會做以下幾件事情…
- (1) 存放所有的 overview 紀錄,等等做目錄用。
- (2) 將整個網站的每個頁面跑一次。
- (3) 產出兩種格式的報表-HTML 與 JSON。
- (4) overview 所需的資料,包含 「Performance」、「Accessibility」、「Best Practices」、「SEO」、「Progressive Web App」五個項目與其分數,分數以小數點表示,滿分為 1。這裡簡單做就不轉換了,稍後在個別檢測報告會看到滿分是一百分。
- (5) 產生每頁的報表。
程式碼片段說明如下…
browser = await navigateToIndex();
page = (await browser.pages())[0];
const records = []; // (1) 存放所有的 overview 紀錄,等等做目錄用

console.log('Running Lighthouse...');

for (let i = 0; i < TEST_PAGES.length; i += 1) {
  // (2) 將整個網站的每個頁面跑一次
  const report = await lighthouse(
    `${ENV}${TEST_PAGES[i].link}`,
    {
      // lighthouse 檢測中...
      port: new URL(browser.wsEndpoint()).port,
      output: 'json',
      logLevel: 'info',
      disableDeviceEmulation: true,
      chromeFlags: ['--disable-mobile-emulation'],
    },
    config,
  );

  // (3) 產出兩種格式的報表-HTML 與 JSON
  const json = reportGenerator.generateReport(report.lhr, 'json');
  const html = reportGenerator.generateReport(report.lhr, 'html');
  const categories = Object.values(report.lhr.categories);
  const record = {};

  console.log(`Review results for ${TEST_PAGES[i].id}...`);
  record[
    'Page'
  ] = `<a href='./lighthouse-results-${TEST_PAGES[i].id}.html' target='blank'>${TEST_PAGES[i].id}</a>`;

  // (4) overview 所需的資料,包含 「Performance」、「Accessibility」、「Best Practices」、「SEO」、「Progressive Web App」五個項目與其分數,分數以小數點表示,滿分為 1
  for (let i = 0; i < categories.length; i += 1) {
    const key = `${categories[i].title}`;
    record[key] = categories[i].score;
    console.log(`Lighthouse scores: ${categories[i].title} ${categories[i].score}`);
  }

  records.push(record);

  // (5) 產生每頁的報表
  console.log('Writing results...');
  fs.writeFileSync(`reports/performance/lighthouse-results-${TEST_PAGES[i].id}.json`, json);
  fs.writeFileSync(`reports/performance/lighthouse-results-${TEST_PAGES[i].id}.html`, html);
}
製作目錄
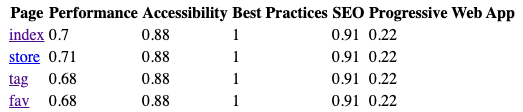
報表產生好了,但總需要有目錄和簡述到底成果如何吧?因此這裡會做一個簡單的目錄,並列出每一頁「Performance」、「Accessibility」、「Best Practices」、「SEO」、「Progressive Web App」五個項目的個別分數。
以下程式碼片段會做以下幾件事情…
- (1) 設定表頭,包含 「Performance」、「Accessibility」、「Best Practices」、「SEO」、「Progressive Web App」五個項目。
- (2) 使用 TableBuilder 產生一份簡單的目錄。
- (3) 將產出的結果寫入 HTML 檔案。
程式碼片段說明如下…
// (1) 設定表頭,包含 「Performance」、「Accessibility」、「Best Practices」、「SEO」、「Progressive Web App」五個項目
const headers = {
  Page: 'Page',
  Performance: 'Performance',
  Accessibility: 'Accessibility',
  'Best Practices': 'Best Practices',
  SEO: 'SEO',
  'Progressive Web App': 'Progressive Web App',
};

// (2) 使用 TableBuilder 產生一份簡單的目錄
const table = new TableBuilder({ class: 'repor-table' })
  .setHeaders(headers) // see above json headers section
  .setData(records) // see above json data section
  .render();

// (3) 將產出的結果寫入 HTML 檔案
fs.writeFileSync(`reports/performance/lighthouse-report-index.html`, table);
產生的目錄如下圖所示(很陽春,待改善 ╮(╯_╰)╭)。
點此看產生的目錄檔範例。
完整程式碼可參考這裡。
YARN / NPM Scripts
這裡寫了幾種檢測效能的 script-檢測單一頁面、依照開發或正式機環境做檢測。
指定單一網址做檢測,yarn lighthouse 後可接受一個網址。注意,這只適用於不用登入的頁面。
yarn lighthouse https://next-meal.vercel.app/
依照開發環境做檢測,由於有搭配 End-to-End Testing 工具來做登入,因此適用需要登入的頁面,且能做全站網頁檢測。
yarn perf-dev
依照正式機環境做檢測,同上,由於有搭配 End-to-End Testing 工具來做登入,因此適用需要登入的頁面,且能做全站網頁檢測。
yarn perf-prod
package.json 的設定範例如下,或參考這裡。
"lighthouse": "./node_modules/lighthouse/lighthouse-cli/index.js --output-path=./reports/performance/lighthouse-results.html $url",
"perf-dev": "node test/performance/index.js --env=DEV",
"perf-prod": "node test/performance/index.js --env=PROD"
疑難雜症
Lighthouse 若不做任何設定,則預設的測試環境是手機(mobile),因此若是想測桌機(desktop),記得在使用 node module 要設定 emulatedFormFactor 為 desktop(若使用 cli 則是 --emulated-form-factor)才能準確測試。Lighthouse 的預設滿多的…像是 throttling 相關,可參考官方文件。
預設是 Moto G4。
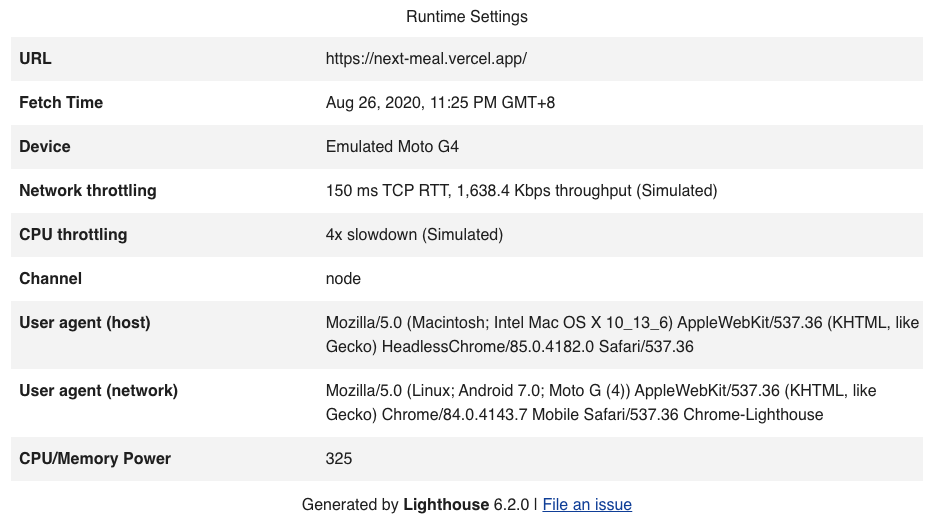
因此是手機畫面截圖。

由於 emulatedFormFactor 改為 desktop,因此「Device」是「Emulated Desktop」。
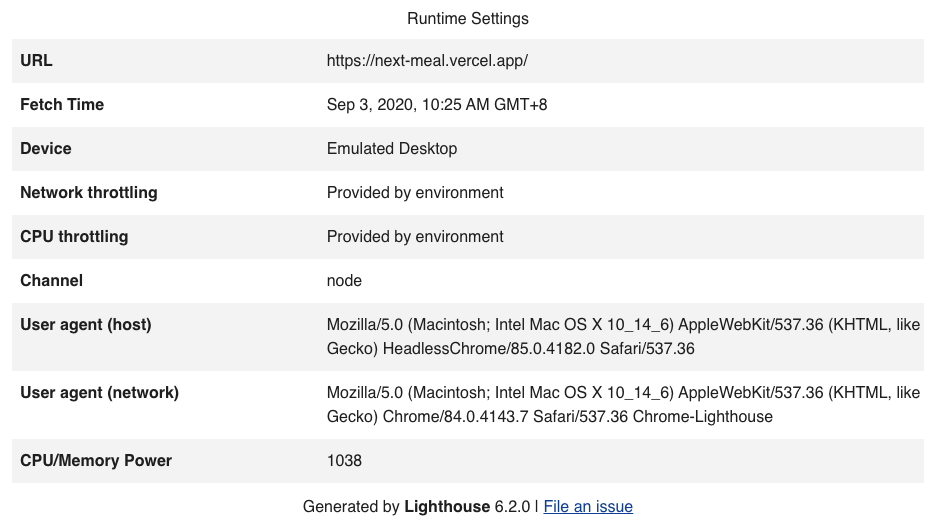
畫面截圖是桌機。

後續工作
之後會有文章來記錄
- 結合 CI/CD,2020/08/27 補上-使用 Jenkins 來自動做前端效能測試
- 將以上使用 Lighthouse 與 Puppeteer 做檢測的方式抽出來成為一個單獨的工具
- 結合 Puppeteer 與 Chrome DevTools - Web Performance Recipes With Puppeteer
等等的文章,敬請期待 (๑•̀ㅂ•́)و✧
參考資料
- Running Lighthouse on Authenticated Pages
- Running Lighthouse on Authenticated Pages with Puppeteer
- Using Puppeteer with Lighthouse
- ERR_SSL_PROTOCOL_ERROR when making requests between docker containers
- lighthouse-pizza-teer
- Making Better Use of Lighthouse with Puppeteer:本文的解法主要是參考這篇文章。
- How to Run Lighthouse Reports for Multiple Pages
- Variables in package.json:設定參考本身檔案的變數,如果只是要帶變數就在前面加一個錢字號即可。
")


")
