利用 Cypress 和 Sentry 測試前端效能
11 Jul 2023在自動化測試前端效能時,可能會考慮的解法有:(1) Lighthouse CI Action 或 web-vitals library + 丟到某個地方做資料儲存和 dashboard;另一個解法是 (2) 利用 Cypress + Sentry 來取得相關資訊並做呈現。
這篇文章會針對 Cypress + Sentry 這個解法做說明,並比較兩種解法。
流程
在做效能測試時,我們會希望能在統一的環境和機器規格下比較,也希望能定期或針對每個版本來做比較,最好在可能有潛在問題時通知開發者做改善。
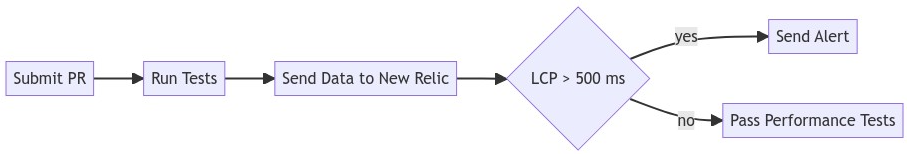
如下流程所示圖,submit PR 後,在 CI/CD 的環境下 (在本文範例中是 GHA) trigger Cypress 的 E2E test script,跑測試並將資料送到 Sentry 或 New Relic 平台上。若資料超過設定的門檻,就發信作為 alert。
說明幾件事:
- trigger 跑測試的時間點除了 submit PR 時,也可以設定 cron job 定期對目前最新的 build 跑測試。
- Sentry 或 New Relic 皆為可蒐集 issue 或 performance data 的平台。它們的功能很多,在這兒不一一描述,可參考 Sentry 是什麼。
- 在這流程中由於是把資料送到 Sentry 或 New Relic,因此就是用它們的 alert 功能了,這些都是可以換成其他實作方式的。
- Cypress 的 E2E test script 可用 mock data 或線上產品,mock data 可用來測試資料量極大的狀況。不過,使用 mock data 來做 E2E test 基本上是不符合這類型測試的意義的,但在此是為了排除干擾測試的因素,像是網路不穩等,單純比較前端或說是瀏覽器的這個部份。
實作
利用 Cypress + Sentry 來做效能測試,要怎麼做呢?一步步拆解來看。
Step 1:由於要辨識跑測試的環境,因此在 GitHub 的 Secrets and variables 設定環境變數;如果想在本機測試記得要設定 .env 檔。這是為了當效能資料上傳到 Sentry 上時,要能辨識這是否為這樣的測試資訊,稍等會將這個資訊丟到 Sentry 上此 event 的 tag。
PERFORMANCE_TEST=cypress
Step 2:安裝 Cypress 和 Sentry,由於在這裡是用 react 建立專案,因此是安裝 @sentry/react,Sentry 有支援其他前後端各種語言,選擇適當的安裝說明即可看到相關的範例程式碼。
yarn add cypress @sentry/react
接著,檢視在 package.json 是否有 Cypress 的測試 script,記得設定檔要設定正確。
"scripts": {
  "cypress:open": "./node_modules/cypress/bin/cypress open",
  "cypress": "./node_modules/cypress/bin/cypress run"
}
加入測試檔案。
describe('performance test', () => {
  it('view this page', () => {
    cy.visit('http://localhost:3000/');
    cy.intercept('GET', '**/api=get-list', {
      "code": 200,
      "message": "success",
      "data": [{
          "photoUrl": "https://sample.com.tw?id=12345",
          "thumbnailUrl": "https://sample.com.tw/thumbnail?id=12345",
          "imageId": "12345",
          "name": "蛋糕 A"
        },
        {
          "photoUrl": "https://sample.com.tw?id=23456",
          "thumbnailUrl": "https://sample.com.tw/thumbnail?id=23456",
          "imageId": "23456",
          "name": "蛋糕 B"
        },
        {
          "photoUrl": "https://sample.com.tw?id=34567",
          "thumbnailUrl": "https://sample.com.tw/thumbnail?id=34567",
          "imageId": "34567",
          "name": "蛋糕 C"
        }
      ]
    });
  });
});
為了要讓瀏覽時送出效能測試資料,要初始化 Sentry、判斷是否在 GHA 環境來送出特定 tag,這樣之後在 Sentry 的 console 上才能順利撈到資料。
import * as Sentry from '@sentry/react';

Sentry.init({
    dsn: "https://test-sample-123456789.ingest.sentry.io/123456789",
    integrations: [
      new Sentry.BrowserTracing({
        tracePropagationTargets: ["localhost", /^https:\/\/test-sample\.web\.app/],
      }),
    ],
    tracesSampleRate: 1.0,
    replaysSessionSampleRate: 1.0,
    replaysOnErrorSampleRate: 1.0,
});

// 判斷是否在 GHA 環境來送出特定 tag
if (process.env['PERFORMANCE_TEST'] === 'cypress') {
  Sentry.setTag('test', 'peformance-test');
}
跑完測試後,稍等一下下即可看到測試結果。
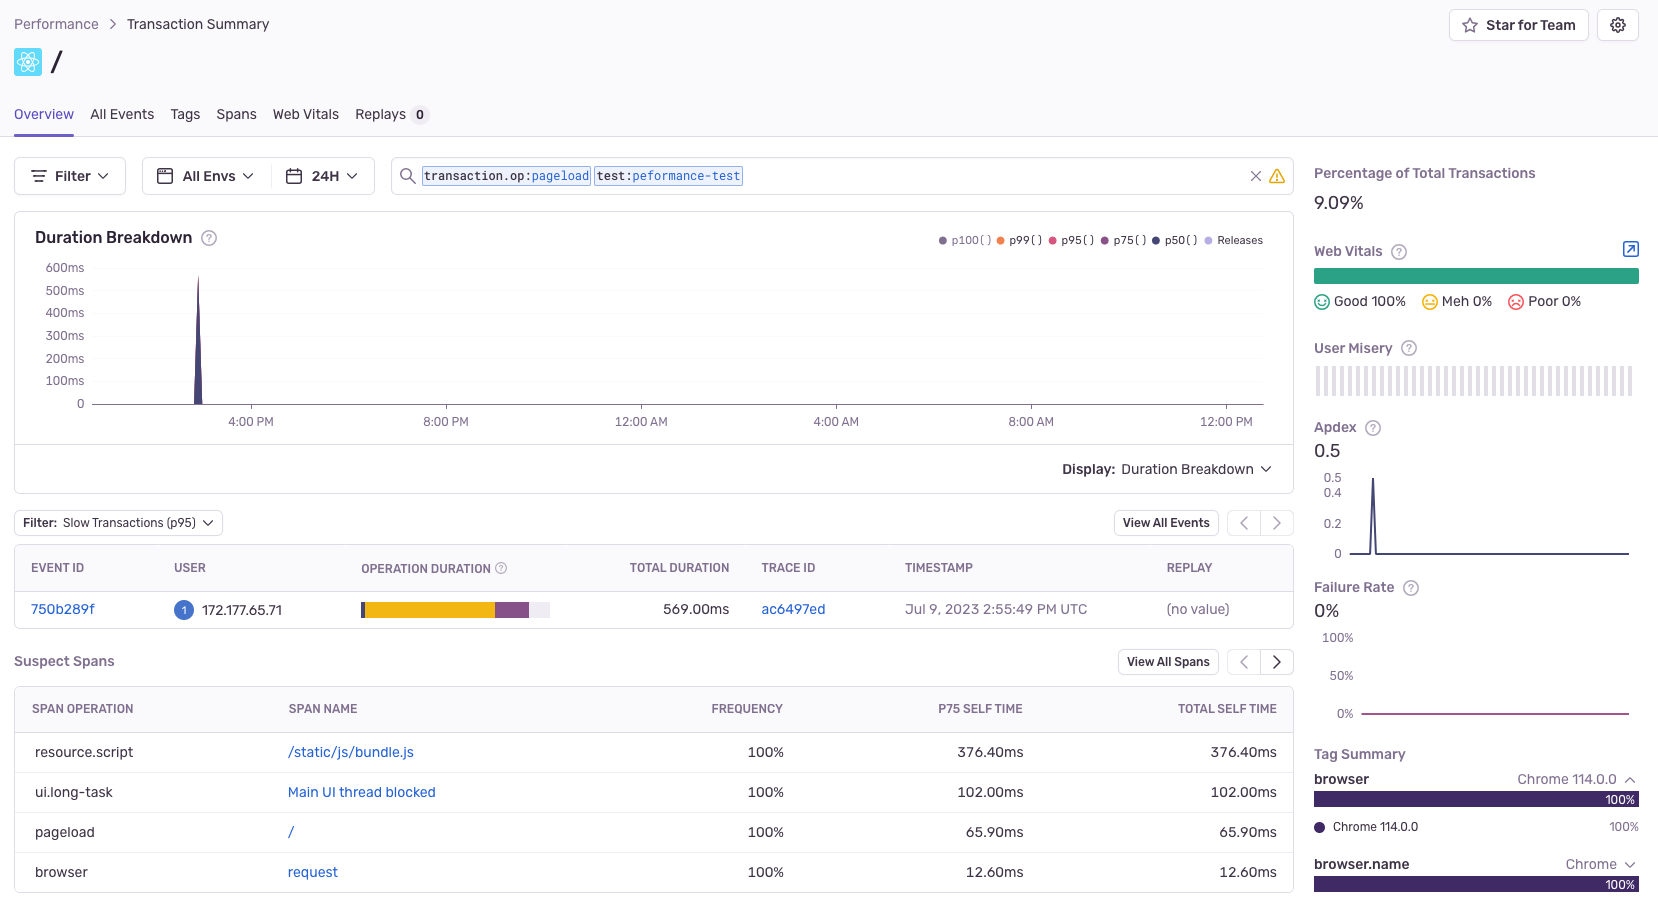
在 Sentry 的 console 上,利用 tag 篩選 test:peformance-test 取得測試結果。
點進去這個 event 後,可以看到更多的細節,像是網路連線、資源載入的狀況、瀏覽器解析與渲染頁面 (不過這裡只會看到 javascript 執行時間來告訴我們是不是 long task) 還有 web-vitals 像是 FCP、LCP 和 FID 等。
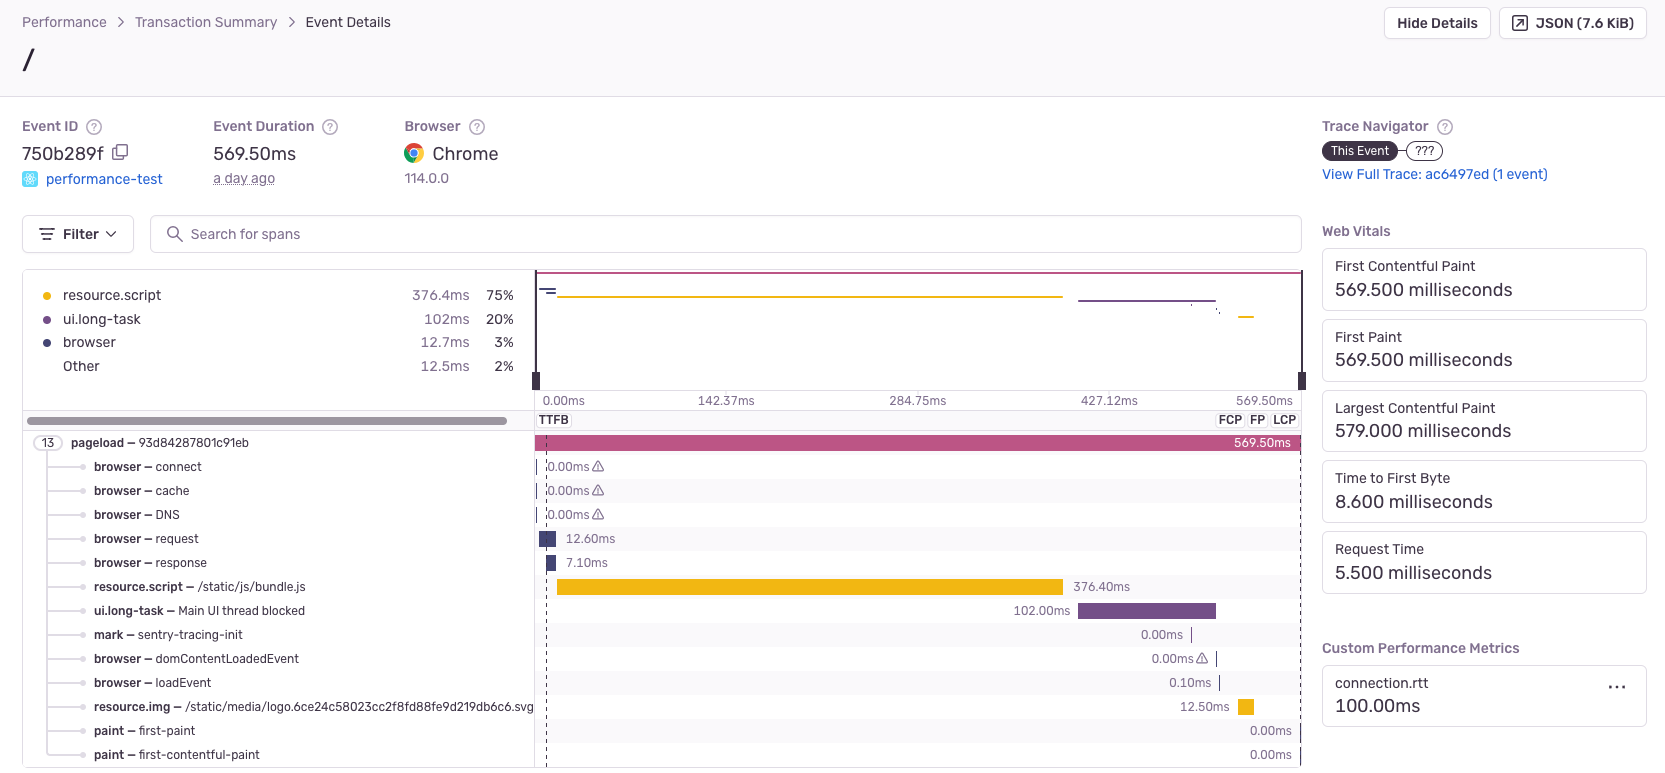
如果對於瀏覽器輸入網址並送出後,到底發生什麼事情這個議題有興趣,可參考這裡。
另外,若測試結果低於預期,則通知相關人等來做改善。關於及時通知怎麼做,可參考這裡。
客製化測試流程
除了觀察頁面載入的狀況外,還可以自行定義要測試的流程,例如:圖片上傳。這是由於除了 Sentry 提供預設的 pageload 外,我們可能還需要追蹤更多的行為、事件或指標,那就需要一些客製化的設定來達成。
在這裡可以寫一個關於上傳圖片的 script,在整個過程中根據我們想要追蹤的部分做些設定來記錄其細節,這個就是 Sentry 的自訂追蹤功能。
來看怎麼設定追蹤客製化的 transaction,並在一個 transaction 裡面切分多個 span 來分段記錄細節。
在設定客製化的 transaction 上,要用 Sentry.startTransaction開始,並用 finish 結尾,它們兩者之間的部份即為追蹤範圍。
在這段範圍內,再利用 startChild 與 finish 切分成多個追蹤區段。例如:使用者想要上傳圖檔,在一連串的操作當中,可分為點擊上傳按鈕、發出 HTTP request 傳送檔案、收到檔案顯示回應訊息。
範例程式碼如下,這一連串的操作行為可當成一個 transaction,然後再切為兩個 span click-submit-button 與 upload-file-request。
import * as Sentry from '@sentry/react';

const transaction = Sentry.startTransaction({ name: 'upload-photo-transaction' });
const handleSubmit = (data) => mutate(data);

const { data, status, mutate } = useMutation({
  //...
  mutationFn: async (data: FileBase64) => {
    spanClickSubmitButton.finish();
    const spanUploadFile= transaction.startChild({ op: 'upload-file-request' });

    return axios.post(`/upload-record`).finally(() => {
      spanUploadFile.finish();
      transaction.finish();
    });
  }
});
當使用者點擊「上傳檔案」按鈕時,開始記錄 click-submit-button 這個 span,並在發出 HTTP request 前結束;發出 HTTP request 時開始記錄 upload-file-request 這個 span,然後在得到回應時結束。
<Button onClick={() => {
    const spanClickSubmitButton = transaction.startChild({ op: 'click-submit-button' });
    handleSubmit(data)
}>
  上傳檔案
</Button>
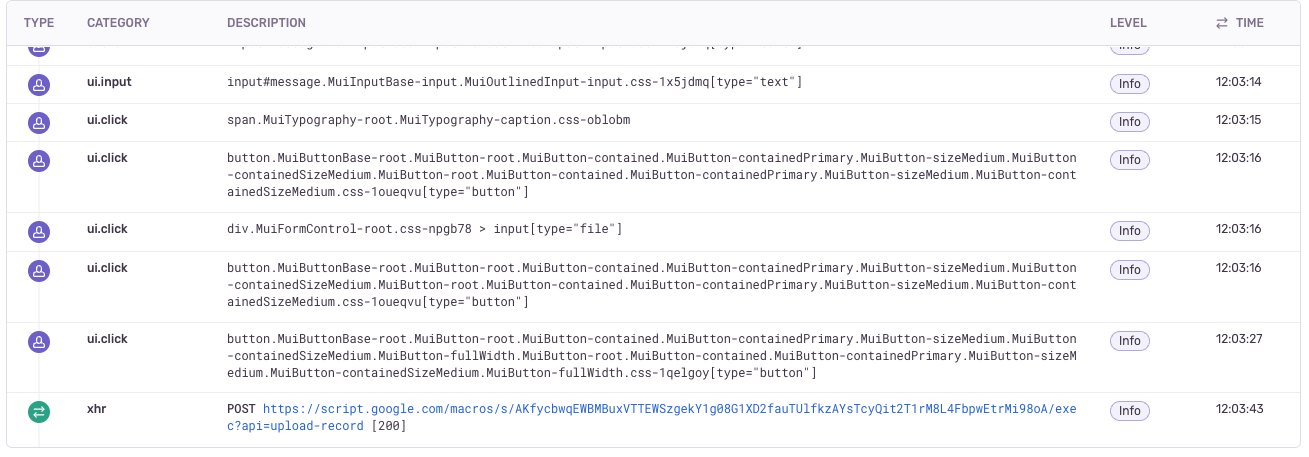
完成操作後,到 Sentry 的 console 查看,會看到這樣的資料。
![]()
客製化追蹤 transaction 和 span 的好處是可以追蹤我們想要的東西,例如在上面的例子,我們特別想知道使用者上傳檔案到底花了多少時間,那麼經由 upload-file-request 這個 span 就能計算出來,在後續要分析資料時也能很方便的被檢索出來。
![]()
產生 rendering performance 最大原因是 long task,藉由觀察 timeline 可知是否有這個問題。
在效能分析上,如果想要分析 loading performance,Sentry 提供 web vitals 的功能已經很足夠了;但若想改善 rendering performance 或特定 UI 的行為,使用 Sentry 的自訂追蹤功能會是很好的解法。
總結
若是在評估要用 (1) Lighthouse CI Action 或 web-vitals library + 丟到某個地方做資料儲存和 dashboard 或 (2) Cypress + Sentry 來測試效能,我的想法是,(1) 與 (2) 都能做到 page load 的效能檢測與提供 web vitals 資訊,唯一不同處在於 (2) 可提供自行定義測試流程,以及除了 web vitals 之外更多資訊…看實際情況來做出適合的選擇吧!
")


")
